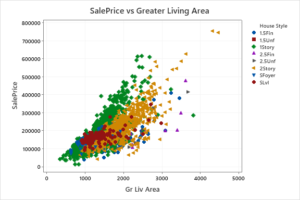
The Ames Housing Data Set is a product of my 2011 sabbatical. At that time I was regularly teaching Linear Regression and there were very few “real world” data sets available for teaching purposes. I typically used the Boston Housing Data set for my end of semester project as it had 506 observations and 14 variables and was a reasonable size for students to analyze. The problem with that data set was that at was already 30 years old at that time and I often would multiply the housing values by a factor of 10 to make them seem more reasonable. As I was an Iowa State University graduate, I was familiar with Ames, Iowa and contacted the city assessor to see if I could work with them during my sabbatical to create a data set of housing prices. By the end of my sabbatical, after quite a bit of work and data cleaning, I produced the Ames Housing Data Set which contains 2930 observations and a large number of explanatory variables (23 nominal, 23 ordinal, 14 discrete, and 20 continuous) involved in assessing home values.
At that time “Big Data” hadn’t really hit the mainstream consciousness yet and I considered the Ames data set to be fairly large. It was 6 times bigger than the Boston data set and had a substantially greater number (and variety) of predictors.
The article was originally published in the Journal of Statistical Education Volume 14 Number 3.
The publication contained 4 files the article, the documentation, and the data file in EXCEL and text format.
In March 2016 the American Statistical Association (ASA) transferred publishing of JSE over to Taylor and Francis. Copies of the article now exist on that site.
Beyond these resources, I will mention that if you are an R user there is now a package in R dedicated to the Ames data set (compliments of Max Kuhn). I believe that particular version of the data has even had the longitude and latitude added for each house. The data set also resides in the SAS and Minitab databases.